
The sedoheptulose kinase CARKL controls T-cell cytokine outputs and migration by promoting metabolic reprogramming
Michelangelo Certo, Jennifer Niven, Robert Haas, Paula Rudzinska, Joanne Smith, Danilo Cucchi, Jose R Hombrebueno, Claudio Mauro.
Discov Immunol. 2024 Nov 19;3(1):kyae016
doi: 10.1093/discim/kyae016. eCollection 2024.
Abstract
Background: Immunometabolism is a crucial determinant of immune cell function, influencing cellular activation and differentiation through metabolic pathways. The intricate interplay between metabolism and immune responses is highlighted by the distinct metabolic programs utilized by immune cells to support their functions. Of particular interest is the pentose phosphate pathway (PPP), a key metabolic pathway branching out of glycolysis that plays a pivotal role in generating NADPH and pentose sugars crucial for antioxidant defense and biosynthesis. The sedoheptulose kinase Carbohydrate Kinase-like protein (CARKL), an enzyme involved in the PPP, emerges as a critical regulator of cell metabolism and was previously shown to play a role in macrophage function.
Methods: This study delves into the impact of CARKL expression on T-cell functionality, revealing dynamic alterations in response to cellular activation. Notably, CARKL overexpression leads to significant metabolic shifts in T cells, affecting mitochondrial respiration, ATP production, and inflammatory cytokine profiles. Furthermore, CARKL modulation influences T-cell motility by regulating chemokine receptor expression, particularly compromising CXCR3 expression and impairing T-cell migration in response to specific chemokine signals.
Conclusions: These findings underscore the multifaceted role of CARKL as a metabolic regulator shaping T-cell responses. Overall, our data reveal the complex regulatory mechanisms orchestrated by CARKL in T-cell function, with implications for immune regulation. Further exploration of the molecular interactions between CARKL and metabolic reprogramming in T cells could provide valuable insights into immune regulation and potential therapeutic strategies.
Keywords: CARKL; T cells; immunometabolism; inflammation; pentose phosphate pathway; reprogramming.
© The Author(s) 2024. Published by Oxford University Press on behalf of the British Society for Immunology.
Figures
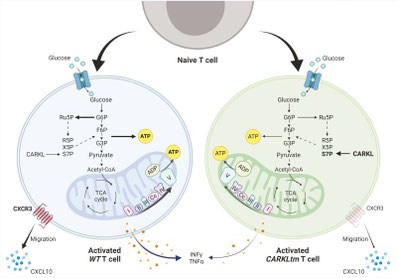
Graphical Abstract
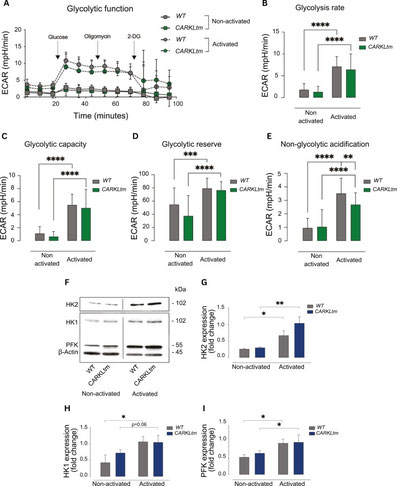
Changes in CARKL expression results in a slight decrease in glycolysis. (A) Graph showing the Extracellular Acidification Rate (ECAR) of WT and CARKLtm CD4 T cells before and after activation, as measured by the Seahorse XFe analyzer. Sequential injections of glucose (time point 1), oligomycin (time point 2), and 2-deoxyglucose (2-DG, time point 3) were performed to assess the glycolytic function. (B) Bar graph illustrating the baseline glycolysis rate in WT and CARKLtm CD4 T cells before and after activation. (C) Maximum ECAR achieved following oligomycin injection, indicating the glycolytic capacity of WT and CARKLtm CD4 T cells. (D) Difference between the maximum ECAR after oligomycin injection and the baseline ECAR before glucose injection, representing the glycolytic reserve. (E) ECAR measured after 2-DG injection, reflecting non-glycolytic acidification in WT and CARKLtm CD4 T cells. (F) Immunoblot showing HK2, HK1, PFK, and β-actin loading control protein levels in WT and CARKLtm CD4 T cells before and after activation. Representative image of one of three independent experiments. The relative protein expression levels were quantified by densitometry and normalized to the control sample (G-I). Data are presented as mean ± standard deviation (SD) from at least three independent experiments. *P < 0.05, **P< 0.01, ***P < 0.001, ****P < 0.0001 by two-sided paired t-test.
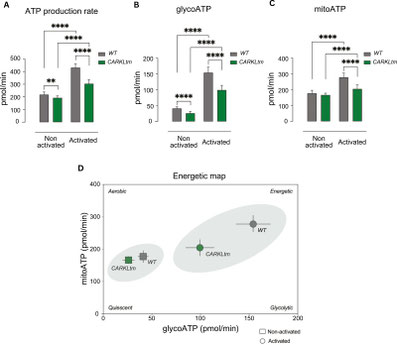
Impaired ATP production in activated CARKLtm CD4 T cells assessed via XF Real-Time ATP Rate Assay. (A) Bar graph showing the total ATP production rate in WT and CARKLtm CD4 T cells before and after activation, as measured by the XF Real-Time ATP Rate Assay. (B) Rate of ATP production from glycolysis in non-activated and activated WT and CARKLtm CD4 T cells. (C) Rrate of ATP production from oxidative phosphorylation (OXPHOS) in WT and CARKLtm CD4 T cells before and after activation. (D) Qualitative depiction of the cellular energy status of WT and CARKLtm CD4 T cells before and after activation. Data are presented as mean ± standard deviation (SD) from at least three independent experiments. **P < 0.01, ****P < 0.0001 by two-sided paired t-test.

Chemokinesis towards Cxcl10 is specifically inhibited in CARKLtm CD4 T cells. Bar graphs showing the migration of activated WT and CARKLtm CD4 T cells towards CXCL10 (A), CCL22 (B) and CCL19/21 (C) at different time points (2, 4, and 6 hours). CN: control, no chemokine. (D-F) Bar graphs showing the mRNA expression levels of the chemokine receptors Cxcr3, Ccr4 and Ccr7 in activated WT and CARKLtm CD4 T cells. Data are presented as mean ± standard deviation (SD) from three independent experiments. Representative flow cytometry plots showing the frequency of CD4 T-cell population identified in adoptive transfer recipient mice, which had received in vitro activated and labeled WT or CARKLtm CD4 T cells (G), WT CFSE labeled and CARKLtm DDAO labeled identified within the CD4 T-cell population, 3 hours prior to receiving an intraperitoneal injection with CXCL10 (1200 ng/mouse) (H), and histograms of CXCR3, indicating mean fluorescence intensity (MFI) gated from CFSE or DDAO labeled populations (I) from splenocytes isolated from recipient mouse. Scatter plots show the frequency of WT CFSE labeled and CARKLtm DDAO labeled cells within the CD4 T-cell population and MFI of CXCR3 from spleen (J, N), pLN (K, O), mLNs (L, P), and lavage (M, Q). *P < 0.05, **P < 0.01, ***P < 0.001, ****P < 0.0001; #P < 0.05, ##P < 0.01, by two-sided paired t-test.

Differential CARKL expression patterns in CD4 T cells from WT and CARKLtm mice. (A) Immunoblot showing CARKL and β-actin loading control protein levels in non-activated and activated WT and CARKLtm CD4 T cells. Representative image of one of three independent experiments. The relative protein expression levels were quantified by densitometry and normalized to the control sample (B). (C) Bar graph representing the relative expression levels of CARKL mRNA in WT CD4 T cells activated for 1, 2, 3 days or left non-activated. (D) CARKL protein concentration in naïve and activated CD4 T cells, retrieved from the Immunological Proteomic Resource. (E) qPCR analysis showing the expression of the glucose transporters Glut1, Glut2, Glut3 and Glut4 in WT and CARKLtm CD4 T cells upon activation. Data are presented as mean ± standard deviation (SD) from at least three independent experiments. *P < 0.05, ***P < 0.001, ****P < 0.0001 by two-sided paired t-test.
Changes in CARKL expression results in a slight decrease in glycolysis. (A) Graph showing the Extracellular Acidification Rate (ECAR) of WT and CARKLtm CD4 T cells before and after activation, as measured by the Seahorse XFe analyzer. Sequential injections of glucose (time point 1), oligomycin (time point 2), and 2-deoxyglucose (2-DG, time point 3) were performed to assess the glycolytic function. (B) Bar graph illustrating the baseline glycolysis rate in WT and CARKLtm CD4 T cells before and after activation. (C) Maximum ECAR achieved following oligomycin injection, indicating the glycolytic capacity of WT and CARKLtm CD4 T cells. (D) Difference between the maximum ECAR after oligomycin injection and the baseline ECAR before glucose injection, representing the glycolytic reserve. (E) ECAR measured after 2-DG injection, reflecting non-glycolytic acidification in WT and CARKLtm CD4 T cells. (F) Immunoblot showing HK2, HK1, PFK, and β-actin loading control protein levels in WT and CARKLtm CD4 T cells before and after activation. Representative image of one of three independent experiments. The relative protein expression levels were quantified by densitometry and normalized to the control sample (G-I). Data are presented as mean ± standard deviation (SD) from at least three independent experiments. *P < 0.05, **P< 0.01, ***P < 0.001, ****P < 0.0001 by two-sided paired t-test.

CARKL overexpression alters inflammatory cytokine profile in CD4 T cells without affecting Th2 cytokine production. Scatter plots showing the levels of IFNG (A), TNF (B), IL4 (C), IL5 (D), IL9 (E), and IL13 (F) produced by WT and CARKLtm CD4 T cells before and after activation. Data are presented as mean ± SD from three independent experiments. (G, H) Scatter plots showing the mRNA expression levels of pro-inflammatory and immuno-modulatory cytokines as assessed by qRT-PCR in WT and CARKLtm CD4 T cells before and after activation. Statistical significance was determined using two-sided paired t-test, where **P < 0.01, ****P < 0.0001.